
The IoT Climate Hub: Keeping It Cool with Real-time Humidity and Temperature Monitoring
I talk about creating a handy home IoT system for monitoring temperature and humidity. Using ESP32 and NodeMCU with sensors, it feeds data to a Raspberry Pi for real-time climate stats. Simple, smart, and super useful for keeping my space just right.
Ah, the buzzing world of IoT! Seems like wherever you turn, there’s chatter about it – especially the buzz around affordable boards like the ESP32 and NodeMCU, equipped with built-in WiFi and Bluetooth. These tech gems are seriously bringing IoT within everyone’s grasp. Stumbled upon an irresistible deal on the SHT20 temperature and humidity sensor recently – less than a buck a piece! Naturally, I snagged a handful for every nook and cranny of my pad. Sorry wallet, but these babies are essential.
 Demo
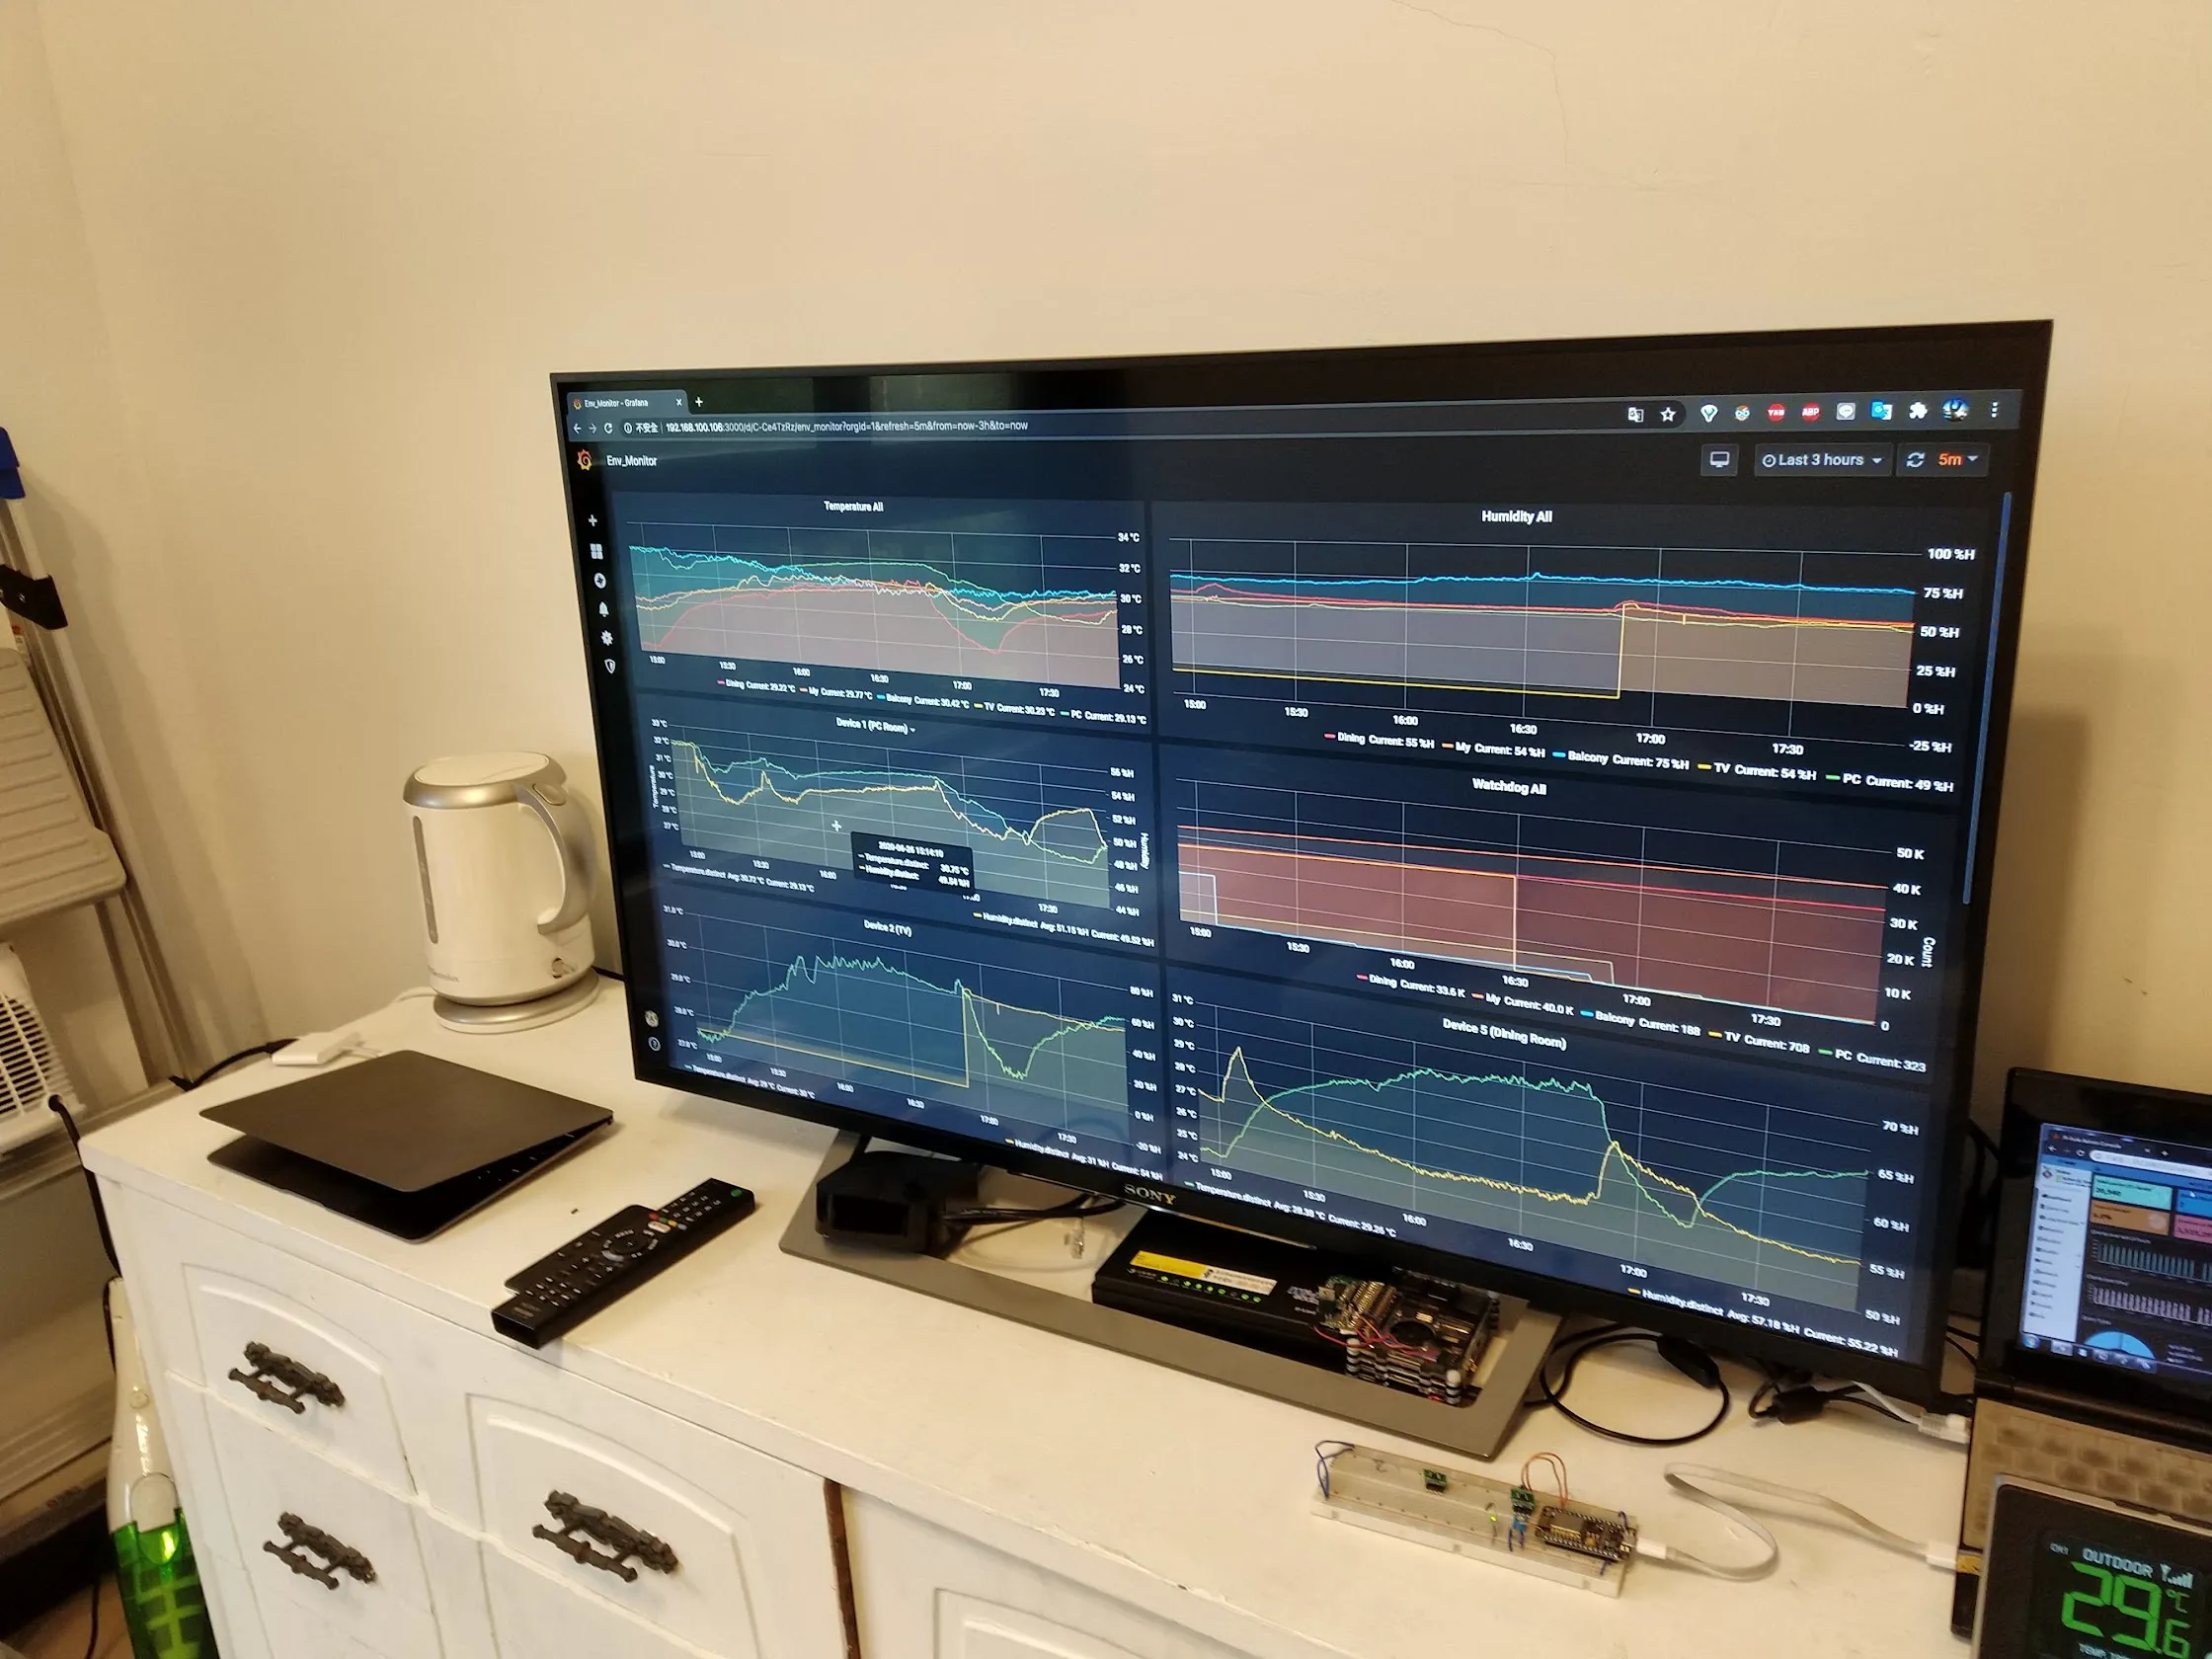
DemoLiving in a place where the humidity levels play tag, and with a room housing sensitive tech gear (think gaming PC, oscilloscope, signal generators, power supplies, and a 3D printer), the paranoia is real. Even with a dehumidifier working overtime, an engineer like me craves hard numbers. Thus, was born my ambient monitoring system using NodeMCU + SHT20 as Data Acquisition Units (DAQ). Threw in a potentiometer to conveniently assign Device IDs – same code, just a twist to differentiate.
 Home Usage
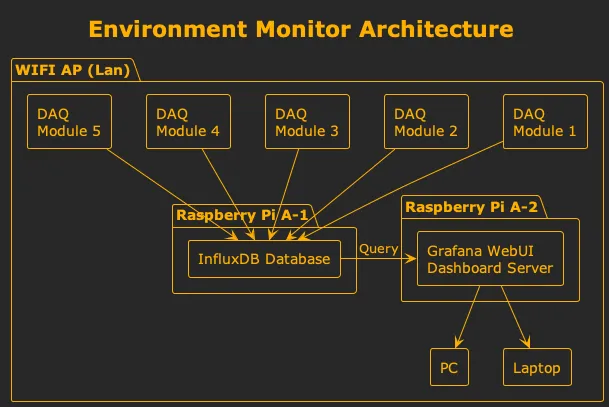
On the data end? Two first-gen Raspberry Pis got enlisted. One hosts the InfluxDB (yeah, that’s a Time-Series Database for the uninitiated) while the other powers the Grafana WebUI dashboard. The setup: each DAQ sends its readings over a localized WiFi network to the InfluxDB. Grafana dips in periodically to visualize these readings. Endgame? A laptop, a connection to the WiFi AP, and voila – instant updates on climate stats from the living room to the balcony.
 Architecture
P.S.: Threw in a watchdog for system stability. In case the DAQ crashes due to WiFi congestion, it’ll reboot automatically. Data regarding these reboots is also charted, offering a sneak peek into the network’s health. Sweet, right?
Give it a try ?
Prerequisites
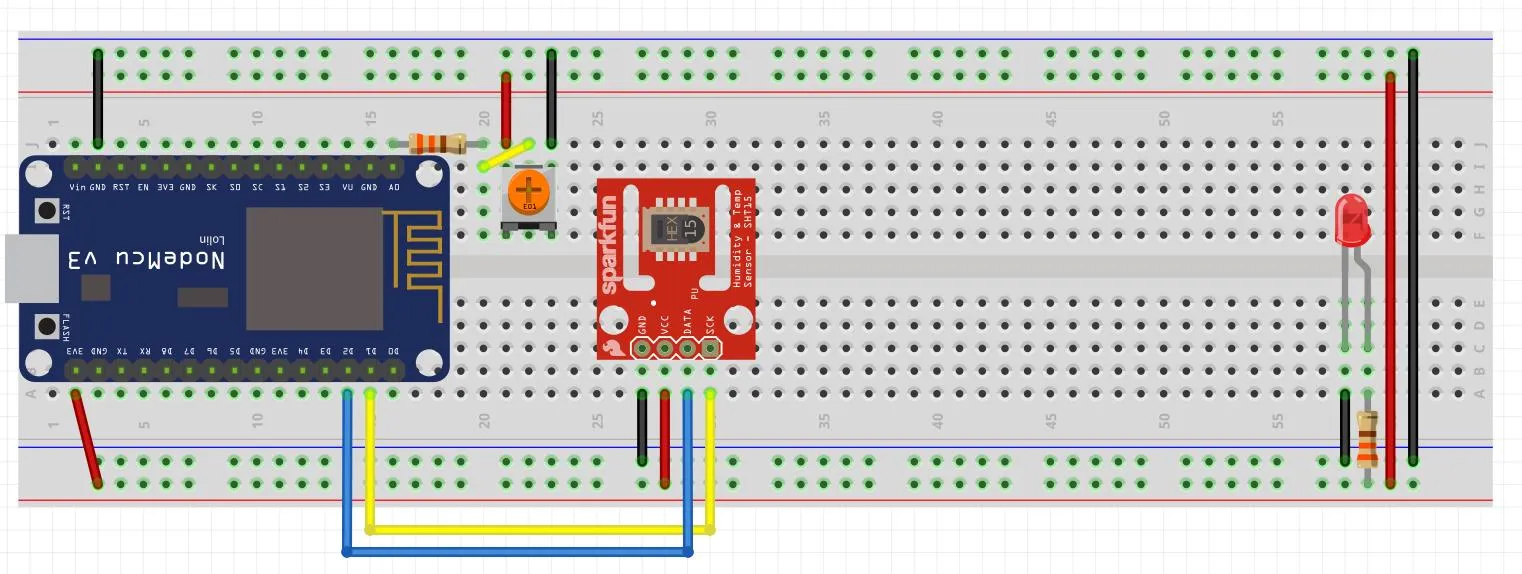
Circuit
- Raspberry Pi *1 (Run web server and database service)
- NodeMCU *1
- SHT20 *1
- Resistor 330Ω *2
- LED *1
- Couple wires
 Circuit
Install
Install tools for NodeMCU from Pipfile:
pipenv install
How to start
Make sure InfluxDB and Grafana service is already running. and
there is a database in InfluxDB. Edit /env_monitor/config.json.
STA_SSID, STA_PASSWORD is for which wifi device NodeMCU connect to.
AP_SSID, AP_PASSWORD is for debug remotely.
Setting device id by turing potentiometer.
Upload code to NodeMCU:
./run_all.sh.Connect to NodeMCU through USB for debug:
./connect_device.sh. If everything goes well, you will see some information like below.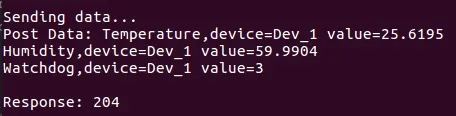 Console
Open Grafana webpage and import
/grafana/Env_Monitor.json. Or you can design your own dashboard.Cheers \m/
Troubleshooting
If InfluxDB and Grafana set on different server
- Set admin and password:
CREATE USER admin WITH PASSWORD 'password'
Edit InfluxDB configuration file
- Linux: /etc/influxdb/influxdb.conf
- macOS: /usr/local/etc/influxdb.conf
[http] enabled = true bind-address = ":8086" auth-enabled = true log-enabled = true write-tracing = false pprof-enabled = true pprof-auth-enabled = true debug-pprof-enabled = false ping-auth-enabled = true- Update configuration:
sudo /usr/bin/influxd -config /etc/influxdb/influxdb.conf
- Set admin and password:
If there is something goes wrong on uploading code.
- Edit
code_rest.shuse--flash_size=detect 0command.
- Edit